
Lloyds Banking Group: laser sharp focus on KPIs
António Horta Osório this year is celebrating his eight-year anniversary of being at the helm of Lloyds Banking Group. The financial crisis of 2008 threw the banking giant into tumultuous years in the midst of which Osório, the new chief executive, joined. Much has been written about the personal impact on Osório but much less so on how the banker was able to lead Lloyds back to profitability.
In this article,
Jonathan Brech, managing partner at
Cambridge Data, explores what it looks like when large organisations obsess over data and drive impact through rigorous processes.
Laser sharp focus on 13 KPIs
Arriving at Lloyds Banking Group, Osório promptly told his management team, so the anecdote goes, that they were going to be focused on a small number of 13 key performance indicators (KPIs). Only!
A member of his team told me how refreshing it was, you absolutely knew what you were trying to do. It wasn’t called “zero budgeting” then, but you wouldn’t get any investment if you couldn’t point to which of the 13 KPIs your initiative was going to improve. This move seemed brutal to some, but it achieved the change Osório, and many in his management team, wanted.
What do KPIs really mean?
I can’t tell you how many data projects I’ve been a part of where the KPIs are not known or loosely referenced and confused with “levers”. Despite the fact that digital transformation, which brought a wealth of data with it, has been around for over a decade now, senior executives in boardrooms around the globe still struggle to differentiate KPIs from general metrics or levers. And for many businesses, this represents a substantial barrier to achieving revenue growth and higher profitability.
KPIs are an actionable scorecard that keeps your strategy on track. They enable you to manage, control and achieve desired business results.*
In this definition, we see three elements that define a KPI:
- It directly measures the desired business result.
- Each KPI is underpinned by roll-up measurements that drive the key number.
- It keeps the business strategy on track by measuring trend over time.
Reflecting on the definition and application of KPIs, it’s apparent how ruthless focus on the right KPIs inevitably gave Osório and his team the tools and the direction to bring success back to Lloyds.
The right KPIs: defined using process, science and gut
The secret sauce in Osório’s work was undoubtedly getting the KPIs right in the first place. How that’s achieved is extremely important, not only because you may be setting your business up for failure in getting it wrong but also because you will need to get your entire business behind the set KPIs and the roll-up metrics for each.
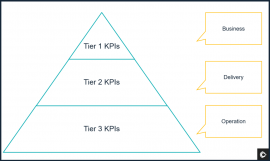
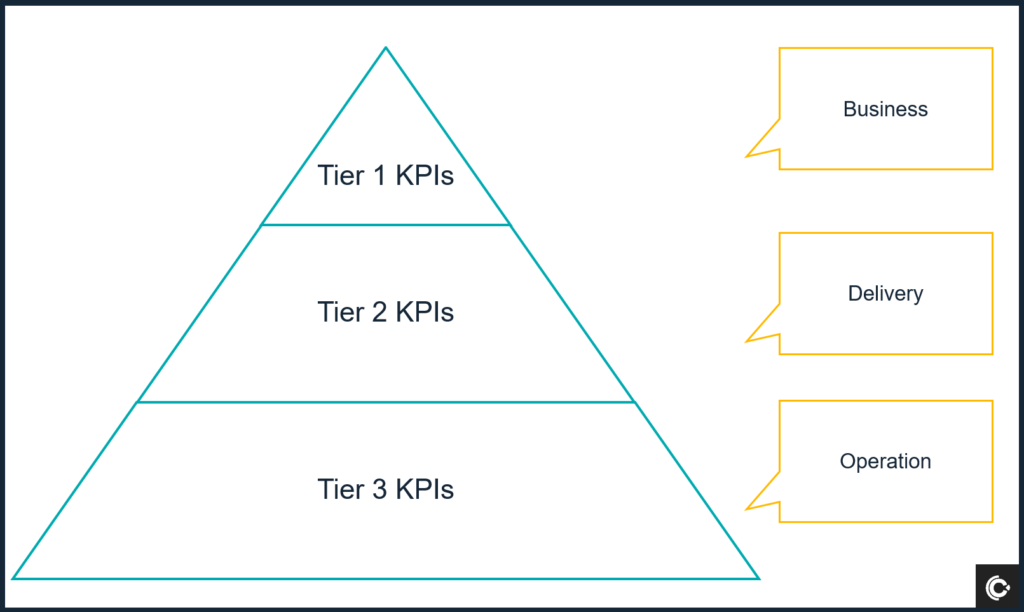
When working with our customers at Cambridge Data, the starting point is usually a kick-off workshop during which I lead the group of senior executives through the KPI pyramid exercise: Everyone calls out the metrics they think are important and worthy of weekly measurement. That helps them to focus their minds. Then I insist that we’re only going to have six in the pyramid hierarchy (see diagram).
It takes some time for the to-ing and froing of debate, but because the number is limited, it means that focus can be agreed reasonably rapidly and immediately the team can discuss only a small critical set of metrics.
Importantly, those members of the team that believe this to be a helpful method to measure the team’s performance can remember off the top of their heads the numbers on a week-to-week basis, pushing team culture one early step towards a data focus.
In Osório’s case, there may well have been a detailed analysis of the critical levers in the business; the critical metrics had been rigorously modelled out and concluded from deep statistical thinking and these 13 KPIs were the conclusion of that. Equally, he could have set them based on his years of domain experience and the need to speedily focus minds on what he thought was roughly right (perhaps later to have them investigated more clearly).
What’s critical at the end of this process is that each member of the team has the KPIs at their fingertips. You will want to have a dashboard, available on your phone, so you can continuously see if your business performance is on track against the objectives set.
 Embedding the thinking in your business culture
In a recent interview with
Marketing Week, Catherine Kehoe, managing director, group brands and marketing at Lloyds Banking Group, talked about the importance of understanding the impact of every marketing pound that’s invested. As she was restructuring a team of 600 marketers to become more effective, Kehoe reflected on three components this change required: the right capability, technology and processes.
This anecdote showcases the impact establishing the right KPI pyramid can make. It creates a ripple effect across functions with every team rallying behind the KPI they directly influence.
As part of this, establishing the right habits or “processes”, as Kehoe called it, is critical. And that’s where the dashboard comes in: assuming there is a weekly meeting that talks about performance, having a dashboard available means the meeting is not about the numbers or trends as these are common knowledge. Instead, the team discusses what they did last week to test and get results and what they are going to continue or start this week to get new results. It’s a great way for the data-driven team to improve their cadence rate.
This way of working can feel completely alien to a lot of businesses, which is where some companies find it useful to have a facilitator as part of this weekly experimentation cycle. They may call it a scrum master or agile coach; it doesn’t matter, but you don’t want anyone on the team other than the facilitator scribing the actions or maintaining the agenda. It’s not always possible, so the best alternative could be to take a turn and religiously follow a pre-agreed agenda and scribing of actions.
Crucially, data-driven capability can be learned.
 Embedding the thinking in your business culture
In a recent interview with Marketing Week, Catherine Kehoe, managing director, group brands and marketing at Lloyds Banking Group, talked about the importance of understanding the impact of every marketing pound that’s invested. As she was restructuring a team of 600 marketers to become more effective, Kehoe reflected on three components this change required: the right capability, technology and processes.
This anecdote showcases the impact establishing the right KPI pyramid can make. It creates a ripple effect across functions with every team rallying behind the KPI they directly influence.
As part of this, establishing the right habits or “processes”, as Kehoe called it, is critical. And that’s where the dashboard comes in: assuming there is a weekly meeting that talks about performance, having a dashboard available means the meeting is not about the numbers or trends as these are common knowledge. Instead, the team discusses what they did last week to test and get results and what they are going to continue or start this week to get new results. It’s a great way for the data-driven team to improve their cadence rate.
This way of working can feel completely alien to a lot of businesses, which is where some companies find it useful to have a facilitator as part of this weekly experimentation cycle. They may call it a scrum master or agile coach; it doesn’t matter, but you don’t want anyone on the team other than the facilitator scribing the actions or maintaining the agenda. It’s not always possible, so the best alternative could be to take a turn and religiously follow a pre-agreed agenda and scribing of actions.
Crucially, data-driven capability can be learned.
Embedding the thinking in your business culture
In a recent interview with Marketing Week, Catherine Kehoe, managing director, group brands and marketing at Lloyds Banking Group, talked about the importance of understanding the impact of every marketing pound that’s invested. As she was restructuring a team of 600 marketers to become more effective, Kehoe reflected on three components this change required: the right capability, technology and processes.
This anecdote showcases the impact establishing the right KPI pyramid can make. It creates a ripple effect across functions with every team rallying behind the KPI they directly influence.
As part of this, establishing the right habits or “processes”, as Kehoe called it, is critical. And that’s where the dashboard comes in: assuming there is a weekly meeting that talks about performance, having a dashboard available means the meeting is not about the numbers or trends as these are common knowledge. Instead, the team discusses what they did last week to test and get results and what they are going to continue or start this week to get new results. It’s a great way for the data-driven team to improve their cadence rate.
This way of working can feel completely alien to a lot of businesses, which is where some companies find it useful to have a facilitator as part of this weekly experimentation cycle. They may call it a scrum master or agile coach; it doesn’t matter, but you don’t want anyone on the team other than the facilitator scribing the actions or maintaining the agenda. It’s not always possible, so the best alternative could be to take a turn and religiously follow a pre-agreed agenda and scribing of actions.
Crucially, data-driven capability can be learned.